


3ll3d00d
-
Posts
532 -
Joined
-
Last visited
-
Days Won
28
Content Type
Profiles
Forums
Blogs
Gallery
Downloads
Articles
Media Demo
Events
Posts posted by 3ll3d00d
-
-
I wasn't in pure direct mode, and I was measuring from the subwoofer outputs.
My soundcard is a Behringer UCA-202, and I created calibration files for it so the response was perfectly flat before adding the AV7005 or the MiniDSP into the signal chain.
Do ours really measure that differently?
possibly not actually (I'm on a slightly small screen atm), can you zoom in a bit? I used a 20dB wide y axis and 2-40Hz
-
Marantz AV7005 (Red line is XLR, green in RCA)
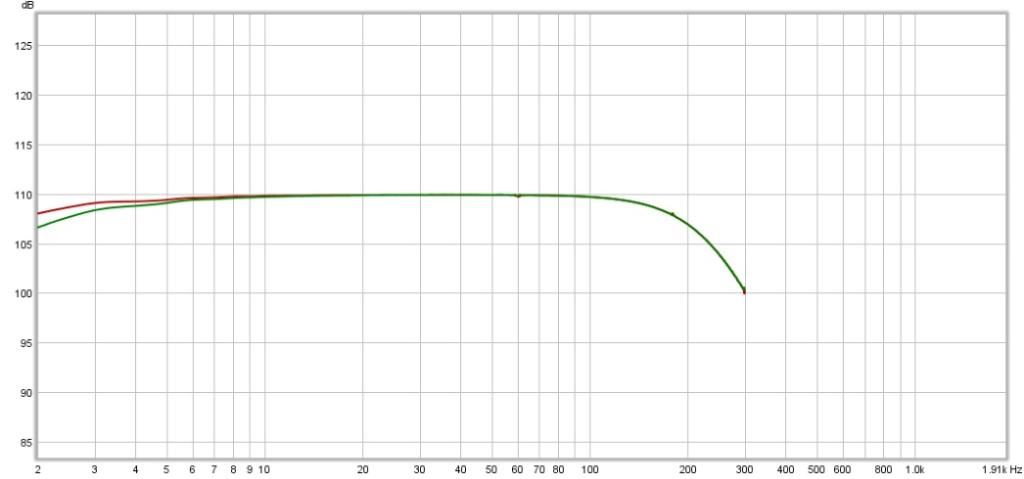
I wonder what the difference between your AV7005 and mine is. Is it just a measurement artefact or some difference in how we have it connected? Also, why would XLR have a different rolloff to RCA?
do we need to post some details about the measurement setup to rule out any such variance perhaps?
-
Can we run a loopback with an HDMI computer? I have everything using HDMI now so how do I do each component? Basically I want to know my AVR LFE out, Sanway amp, etc..
what do you have for the input side?
you can use trace arithmetic here though. Take measurements adding one component at a time (over which you are taking the loopback measurement) then use A / B to see the diff between each measurement, this gives you the contribution of that component to the total rolloff.
-
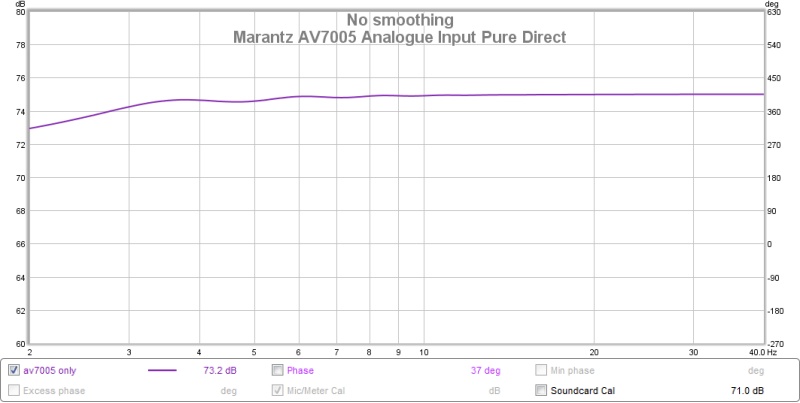
Marantz AV7005 7.1 Analogue Input in Pure Direct
 -1dB at 5Hz-2.75dB at 3Hz-5.75dB at 2Hz
 -
I thought I'd get the ball rolling from
It would be great if those with REW would do a simple loopback of their AVR, PEQ, Pre/Pro, amplifiers, etc. and post them is a thread dedicated to signal chain loopback measurements. It's so easy to do, I wonder why everyone doesn't do it. REW is free and you don't need a mic or anything else to do the loopback.
basic process is just to take an output from whichever device you're measuring and then feed that back to your soundcard (taking due care with levels if measuring an amp) then take a measurement in REW. A few things to bear in mind;
* make sure you have an appropriate (soundcard) cal file loaded to counter any purely measurement artefacts (e.g. a hpf on a line in is not that uncommon)
* If your measurement covers multiple devices (e.g. perhaps you first loopback over your bd player and then you loopback over your bd player + processor) & you have a measurement for each stage then you can use the "A / B" trace arithmetic function to see the contribution of each individual stage
-
 6
6
-
-
I think it is worthwhile though i haven't tried it yet, i intend to when I get my new sub in a few weeks. I will do it via jriver BTW not a nanoavr.I updated the first post with the films to be BassEQ'ed. I'll try to post up one every week. Has anyone tried to do this with the nanoAVR, or am I wasting my time posting this stuff up?
JSS
-
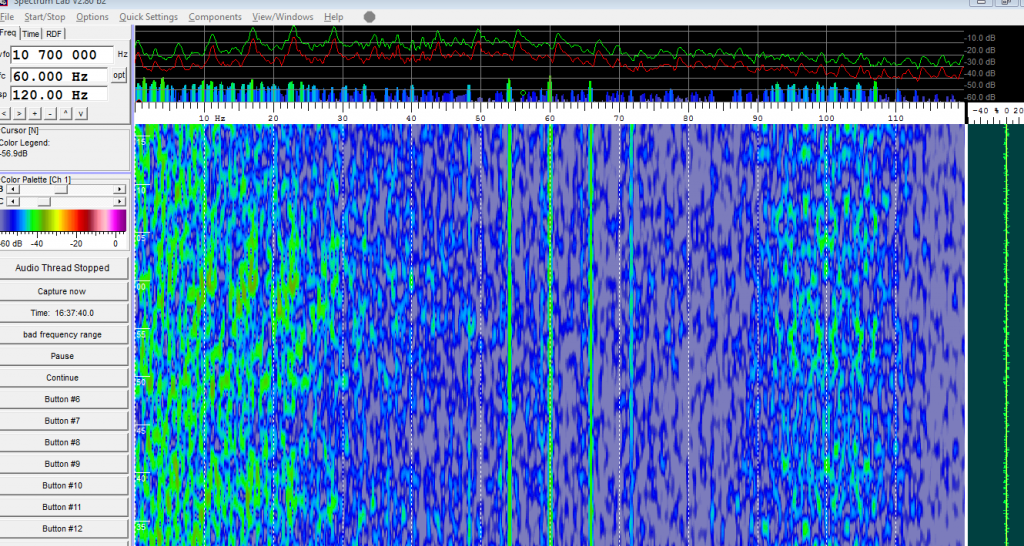
Here's what mine looks like with nothing playing:
How/where do I import the calibration settings for my UMIK?
you can't import it directly, you need to make it into a filter which you then load into speclab. I described how to do it in http://data-bass.ipbhost.com/index.php?/topic/290-using-speclab-for-measuring-in-room/?p=4124
that looks quite noisy though, IIRC my setup had that sort of noise when I had it set to 24bit/sample in the audio i/o rather than 16bit. I would double check that, and the other fft/soundcard settings, to make sure it agrees all the way down the chain, before going further.
-
I plan to look at the Alpine at some point. I am going to upload the RBH SX-1212 measurements in the next day or so and then I have the results from the BMS 18n862 in the sealed box to upload. That is a really nice driver. One of my favs at this point. Not going to compete with the XXX, LMS or Zv4 for sub bass output but it's still respectable and it does everything really well.
Still don't have a box for the 24". Haven't heard from Nick in a while. I figure he is busy.
Have some Reaction Audio subs up for testing next and following those will be Chane HT's new subs.
Already have some interest from other manufacturers for tests after that.
On the DIY front I want to get a Dayton UM-18 in...
did you get the "Mach5 UXL18 (2014 version)" mentioned above tested?
-
If the waveform graph and bar graph are irrelevant to you, you should turn the waveform and bar graphs off because the level is too low to show any detail on the waveform graph and the bar graph shows grossly incorrect data.
why is the bar graph showing grossly incorrect data?
Is there any practical impact, when replaying captured data, to adding an offset by x vs reducing the amplitude range by x?
-
Thanks, I will go back and review against what i have.
I am slightly confused though. What is the point of the exercise here? I was working on the assumption that it is to adjust the colour scheme so that levels are shown relative to the peak levels for that track. The reason being this gives full detail of the relative spectral content of the track. Is this wrong? If so, what is the point?
The latest images were created by not using the up/down arrows but instead clicking on the frequency range under the colours and adjusting the amplitude range there as I thought this is what maxmercy was advising.
Fundamentally though I don't know what difference this makes. It seems to be just an fft analysis with a user selected colour scheme to represent the z axis (amplitude) within some arbitrary user selected min/max range.
-
OK right, this is with no amplitude offset and just fiddling with the colours.


Does that look correct now? I put the wav on my gdrive (in case that helps get the setting right)
The scene in question is a rather visceral artillery bombardment. It is from the DVD btw, this one - http://www.play.com/DVD/DVD/4-/656483/-/Product.html
-
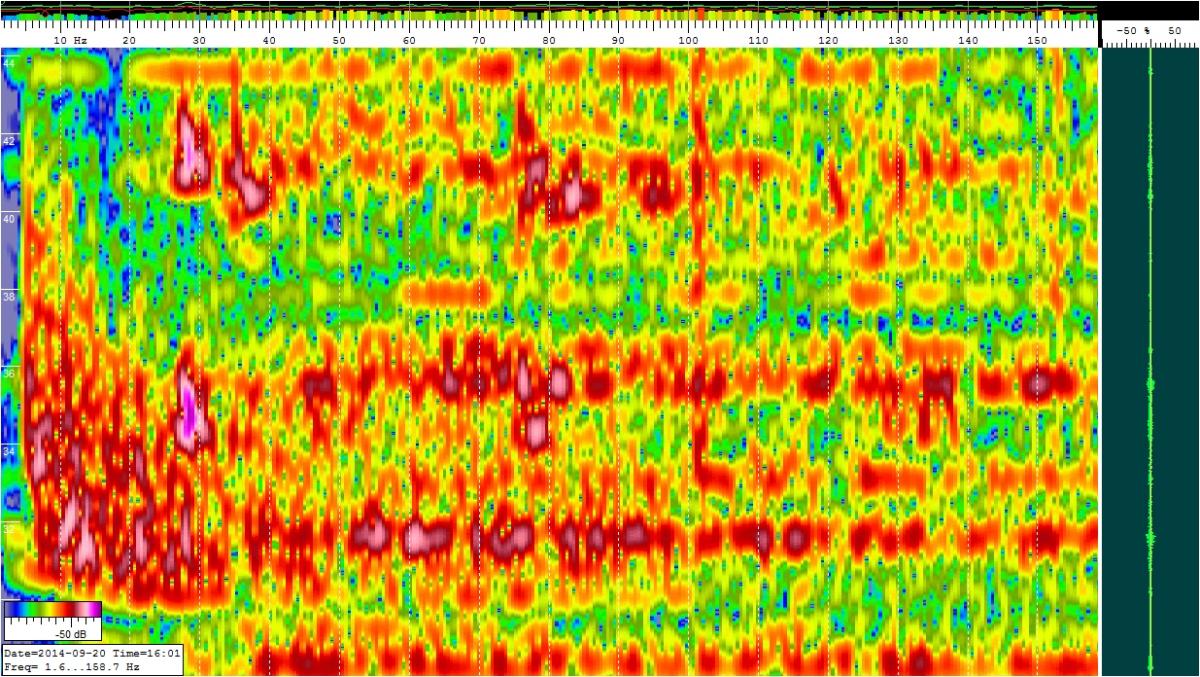
I've recently been trying to get speclab working & I think I'm almost there. I'm doing it primarily for in room measurements but thought I'd go back through some old films that I remember being heavy hitting to see what they look like on paper. I'm JRiver user so have been using desertdome's method (http://www.avsforum.com/forum/113-subwoofers-bass-transducers/1333462-new-master-list-bass-movies-frequency-charts-221.html#post23468771) to extract scenes and put them through speclab.
The first one I tried is a Korean war film called Taegukgi ( I remember being pretty intense to watch, albeit it was a few years ago. I haven't set levels correctly yet (just bumped it up so it was close to the max for the scene from 28-31 mins) but it looks like it has pretty serious extension, or at least the effects look to be at the same level through the full frequency range.

btw, is this the thread for questions on how to get this setup correctly or is there another one I should post in? I did extract the -0.5dB tone from the soho54 disc in the same way but if I set the scale to hit -10 on that and then play taegukgi back then the level is at -40 ish.


The Low Frequency Content Thread (films, games, music, etc)
in Bass Content
Posted